5 Things You Can Learn About Your Channel and Content Performance
A century ago, John Wanamaker said, “Half the money I spend on advertising is wasted. The trouble is I don’t know which half.”
And yet today, even with 100 years of technological advancement, marketers are still struggling to accurately gauge whether or not their marketing is working. Did your customers actually read that blog or whitepaper you sent them? Most marketers are still using inaccurate metrics to attempt to answer this question, like clicks or downloads. But if your customer clicks on your content and bounces after 2 seconds, can you truly call the interaction a success?
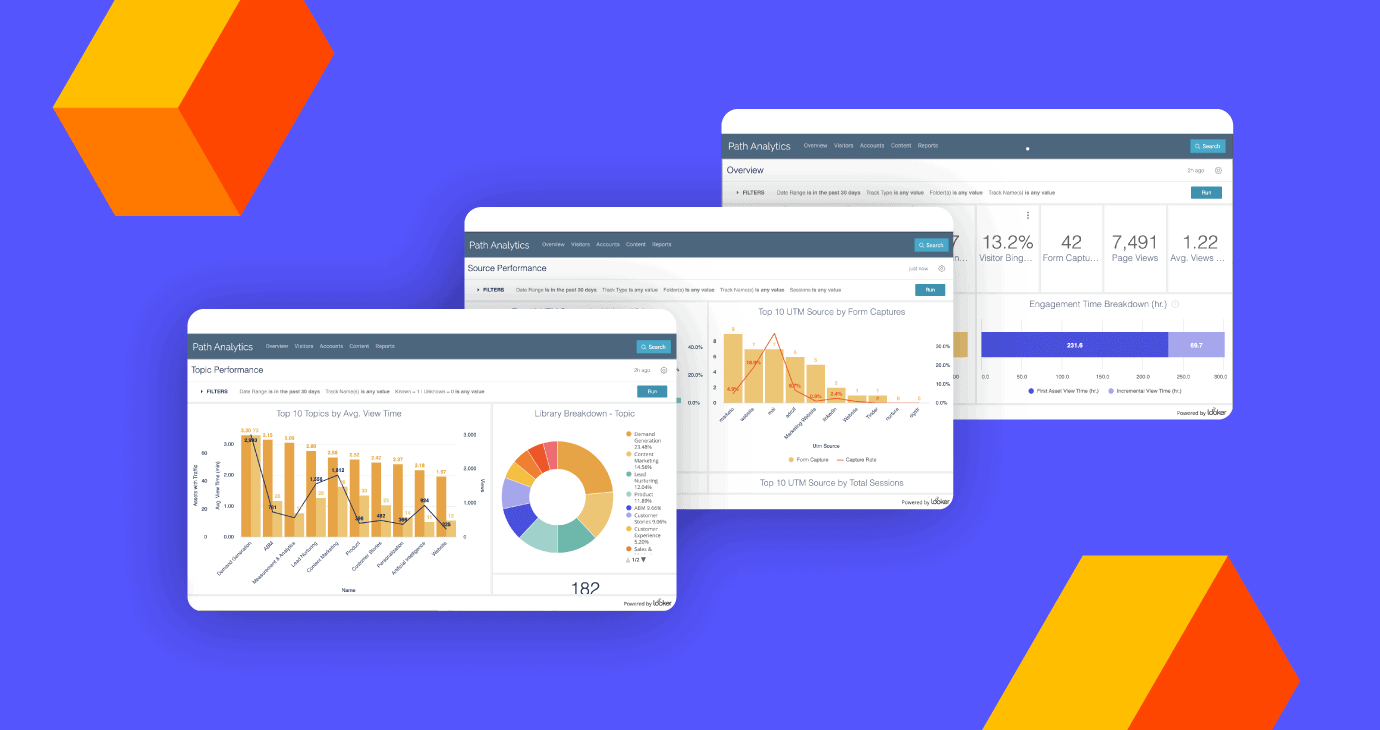
This classic struggle to accurately measure the success of marketing content is why PathFactory partnered with Looker to offer new reporting capabilities. When you combine PathFactory’s industry-leading data set with Looker’s flexibility and data visualization capabilities, you’ve got an extremely powerful toolkit in your hands.
When you go deeper than shallow surface-level metrics, you can finally start answering questions like which channels are bringing you the most engaged audience, and which assets lead to the highest post-click engagement. These golden insights allow you to optimize your marketing and devote the most time and money to the content and channels that move the needle.
In this blog, we’ll take you on a tour of some of the new reports and show you the valuable insights you can uncover that were once impossible to access.
But first, a quick story
Sidney Waterfall, former Head of Marketing at Trupanion, was running paid ads with many different vendors. She was using the numbers of clicks and form fills to determine which vendors were giving her the most bang for her buck. But this meant that she was putting a lot of money and blind faith into programs that were not necessarily generating quality engagement.
But when she started pointing her ads to PathFactory Content Tracks instead of single assets, she had the data to discover that, while one vendor drove more impressions, another was providing dramatically better content engagement on the other side of the click.
One vendor brought an audience that was spending an average of 18 seconds spent consuming content, whereas the other vendor brought an audience that spent an average of 2 minutes 50 seconds consuming content. (Read more about Sidney’s story here.)
This golden insight allowed her to divest from the vendor providing lukewarm leads, and reallocate more of her budget to the one delivering sales-ready prospects.
Ready to uncover this type of insight to boost your own marketing performance? Read on and we’ll show you a sneak peak of our brand new reports.
1. Get a clear picture of which channels are delivering you the deepest content consumption for you
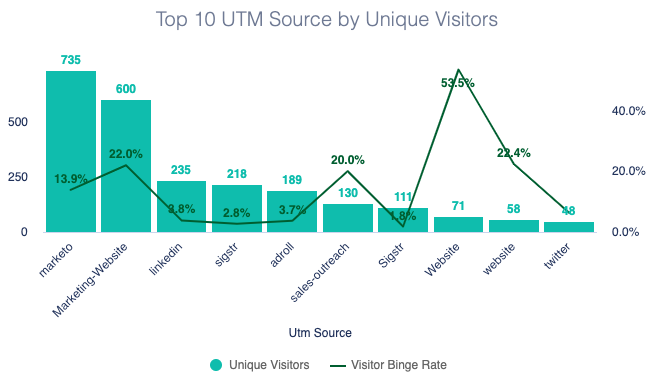
Are your customers hitting your content from social media and bouncing right away? Are the customers you reach via email consuming more of your content? This report helps you answer these questions by showing you how many visitors each channel brings, and what percentage of those visitors binged on your content. (We consider a session where someone reads two or more assets a content binge.)
Our customers are loving this new report. “PathFactory’s new reporting capabilities are a game-changer for our team,” said Jessica Pope, Digital Channels Manager at Cisco. “We can now get a clear picture of which channels, content types, and topics are moving our customers through their lifecycle stages, based on their real content consumption data. These insights help us invest our marketing dollars where they’re most likely to generate more revenue.”
How you can use this insight
Learn which channels are bringing you the deepest engagement, and invest most heavily in these channels. You can also identify low performing channels, and optimize your strategy to improve these.
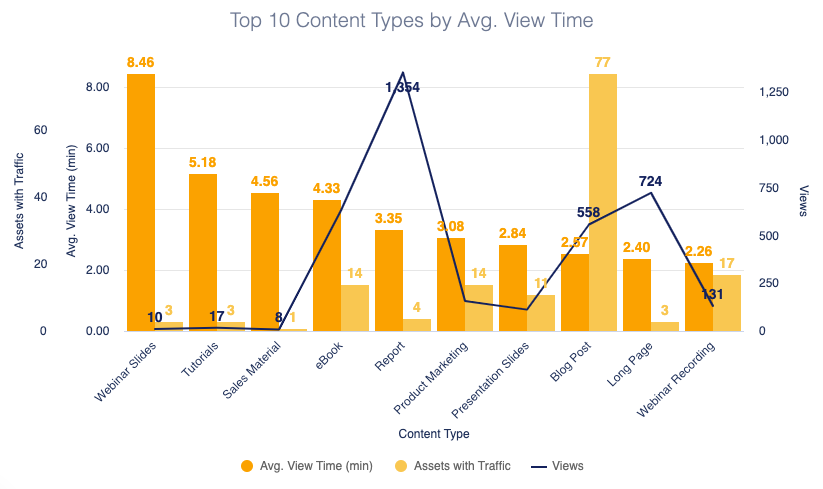
2. Learn which content types your audience prefers
Your newest analyst report may have the most views, but do you know if people are spending longer reading it than, say, your latest blog posts?
This report tells you which content formats yield the longest average view times.
It seems counterintuitive, but in our own marketing at PathFactory, we often find that prospects often spend more time with shorter assets. Your 35 page whitepaper that would take over an hour to read fully? You may be surprised to see a low engagement time. On the other hand, prospects often spend longer periods of time consuming videos and infographics, even though there’s less to them.
That being said, everyone’s audience is different, so nothing beats looking at your own data.
How you can use this insight
Learn which content assets produce the deepest engagement, so you can create more content in the formats your audience prefers, and justify allocating more budget and resources to the content formats your audience enjoys most.
3. Discover which Content Tracks lead to most form fills
Which of your content tracks are helping you convert unknown leads? This reports helps you uncover this and more. You’ll also see the binge rate to understand what proportion of prospects and customers have consumed multiple assets in the Content Track. By understanding the relationship between bingeing on content and converting on a form, you can better decide when and where to place an engagement-based form.
How you can use this insight
Learn which sequences of content help convert unknown visitors, and use these insights to help capture more leads in future campaigns.
4. Surface which topics resonate most with your audience
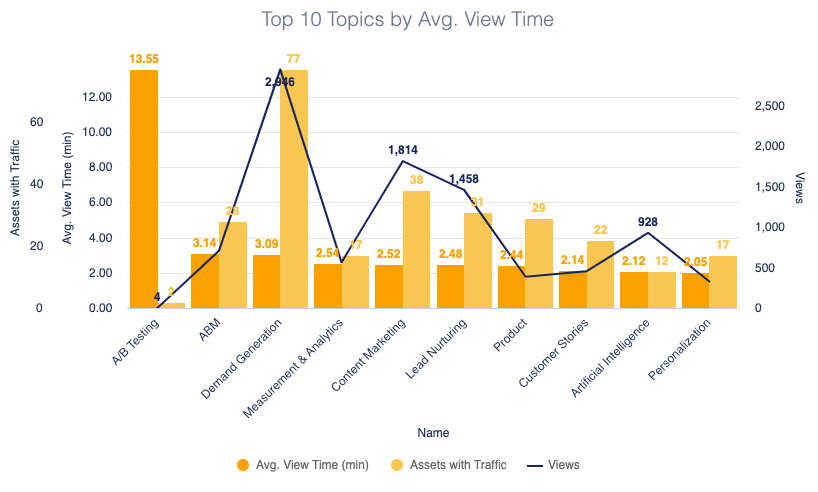
The beauty of tagging your content when you upload it to PathFactory (or having PathFactory automatically suggest tags) is that you can see which topics kept your customers reading for the longest.
This report shows you which content topics or themes lead to the most time spent on content.
How you can use this insight
It’s simple. Figure out what topics are so juicy and interesting that they make your audience binge. Make sure you have enough of that content and, if not, produce more. Use that content in more campaigns. Rinse and repeat.
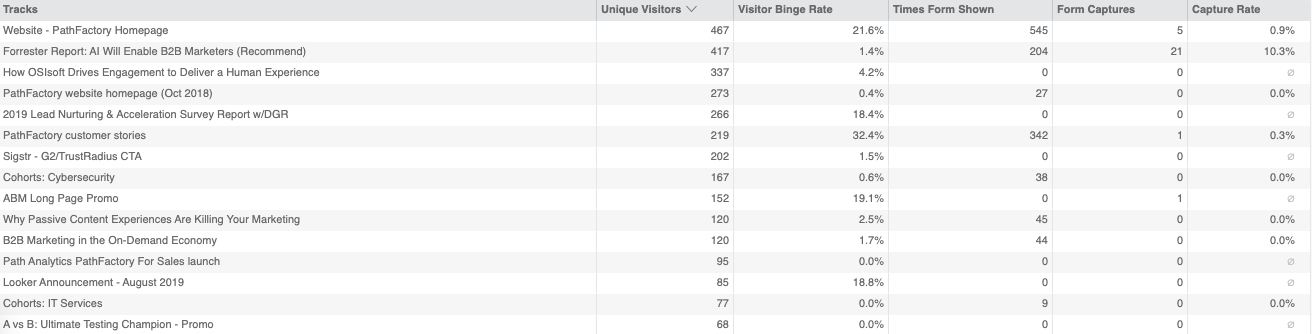
5. Uncover which Content Tracks are highest performing
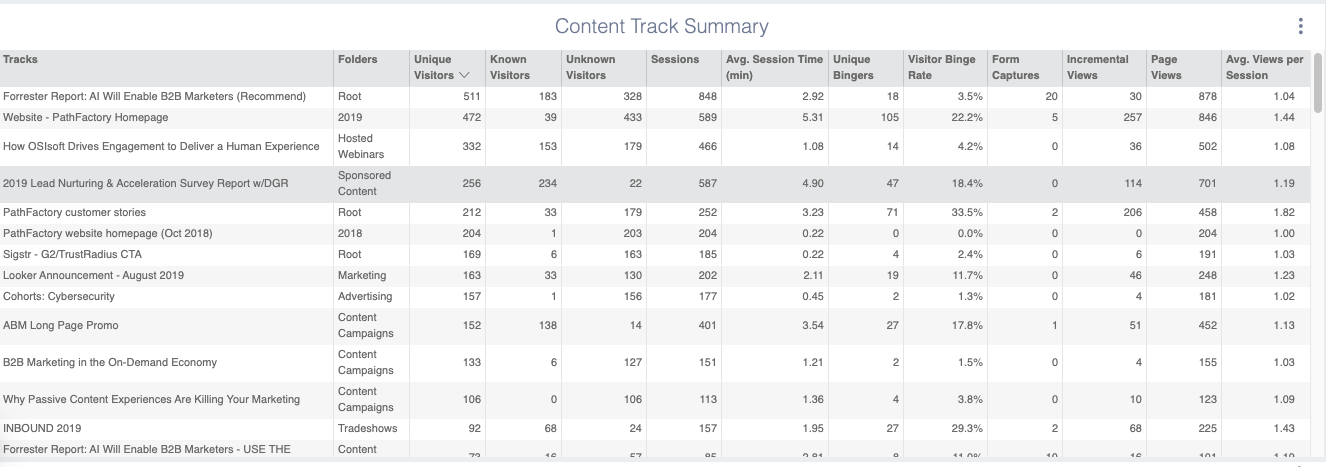
This report allows you to compare the performance of all your content tracks side-by-side. You can answer questions like: which content tracks got the most views? Which content tracks got the most form fills? Which content tracks led to the most binges?
How you can use this insight
Thematically grouping your content is a surefire way to increase engagement, and get your prospects to binge your content. Once you learn which sequences of content are working, you cook up more Content Tracks based on tried-and-true recipes, as well as serve up the most appealing ones in new campaigns.
Getting more juice for your squeeze
As marketers, there will always be demand and pressure to do more, produce more content, launch more campaigns. It can sometimes feel impossible to keep up with competing demands. But if you’re equipped with the right data, you can make smarter decisions about how you spend your time and budget—to get more juice for your squeeze. If you can move a prospect through the funnel with high-performing channels and content that is proven to work, your team can spend less time creating more content that isn’t helping move the needle and can spend less budget on the channels that are bringing poor audiences.
If you’re already a PathFactory customer, good news: you can access these reports right now! Go to Path Analytics, then into the “Reports” tab.